SHT40 Accuracy: Typical vs Maximum Error Explained
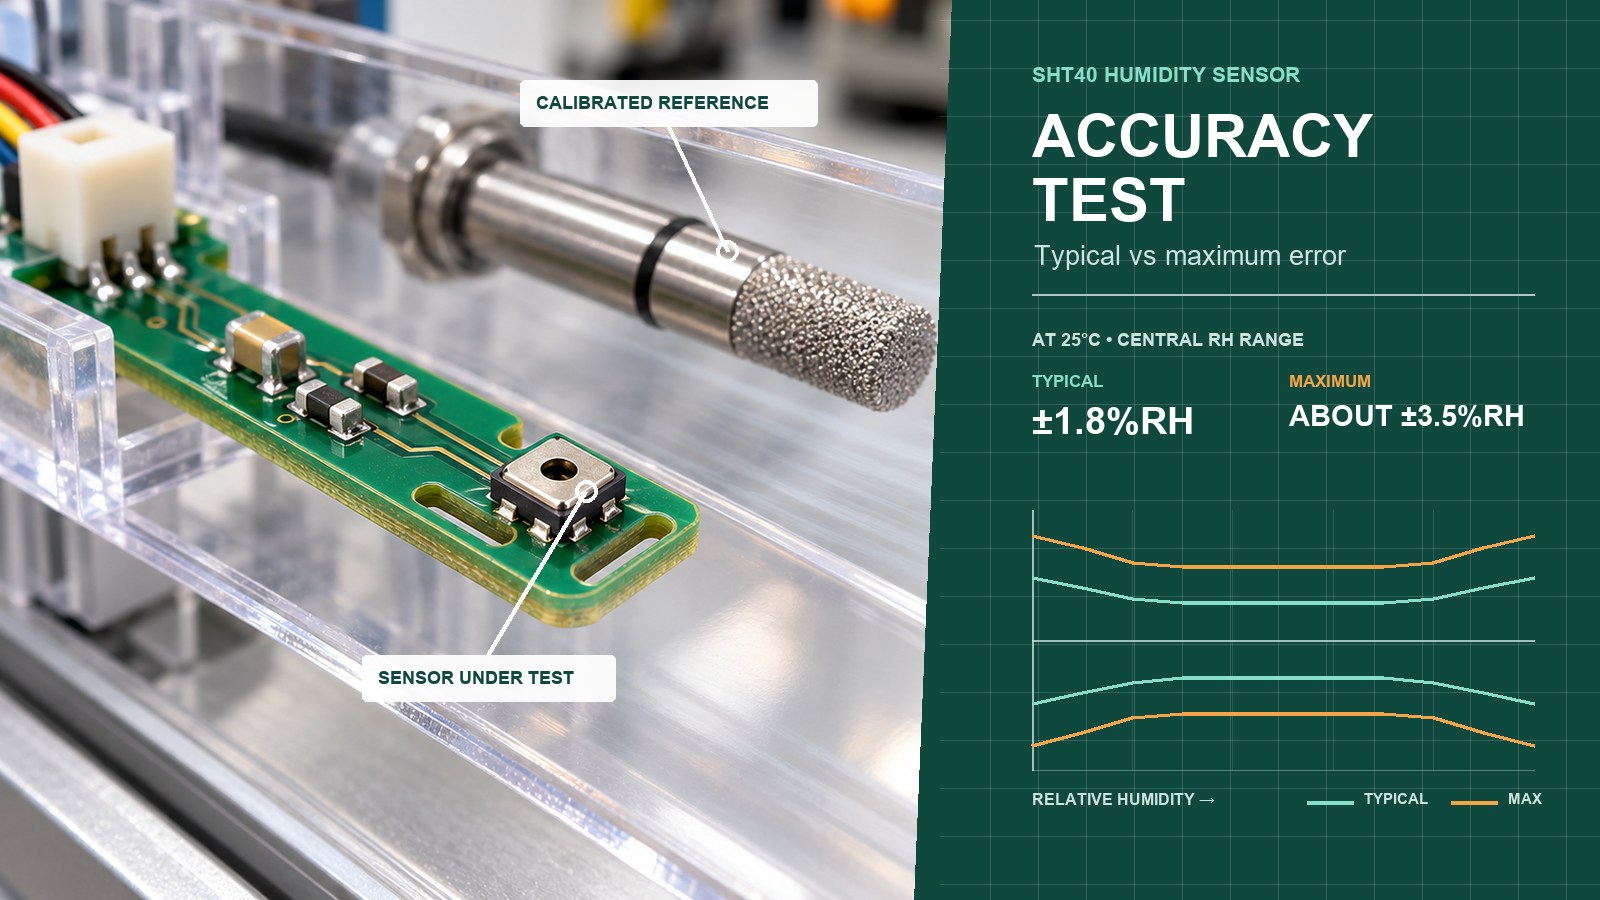
The SHT40 is specified at ±1.8%RH typical and about ±3.5%RH maximum at 25°C in the central humidity range. Those figures answer different design questions. This guide shows how to read the curves, estimate installation error, and decide whether SHT40 can support a finished-product accuracy claim.
The short answer
Use the typical figure to estimate expected performance. Use the applicable maximum curve when a product claim must be supported for production units. The sensor specification covers the sensing element; PCB heat, enclosure airflow, humidity history, ageing and reference uncertainty still affect the finished device.
| Question | Engineering answer |
|---|---|
| What is SHT40 humidity accuracy? | ±1.8%RH typical near 25–75%RH at 25°C; the maximum is about ±3.5%RH through much of the central range. |
| What is SHT40 temperature accuracy? | ±0.2°C typical around room temperature; use the datasheet curve for the maximum limit and other temperatures. |
| Does averaging improve absolute accuracy? | It can reduce random noise, but it does not remove calibration offset or a steady thermal bias. |
| Can SHT40 guarantee a ±3%RH finished product? | Not from the datasheet alone: the component's maximum calibration tolerance already reaches about ±3.5%RH at 25°C and 50%RH. |
Data basis. Unless stated otherwise, specifications below come from the Sensirion SHT4x datasheet, Version 7.3, June 2026. Calculated examples are identified as calculations; they are not laboratory or customer test results.
 What does ±1.8%RH mean?
The unit %RH is a percentage point of relative humidity. It is not a percentage of the reading.
At a true value of 50%RH:
- a ±1.8%RH band spans 48.2 to 51.8%RH;
- a ±3.5%RH band spans 46.5 to 53.5%RH.
Resolution and repeatability do not change those limits. SHT40 may resolve 0.01%RH and produce closely grouped readings while still having a stable offset from the reference. More decimal places describe the output granularity, not guaranteed accuracy.
Typical and maximum answer different questions
Sensirion describes typical and maximum accuracy as production-population limits with different statistical coverage and production controls. The definitions are explained in its Sensor Specification Statement and Testing Guide.
For design work, the practical distinction is simple:
| Specification | Use it for | Do not use it for |
|---|---|---|
| Typical accuracy | Expected performance, architecture comparison and early prototypes | A guaranteed limit for every purchased unit |
| Maximum accuracy | Checking whether the component limit can fit inside a product requirement | Predicting the exact error of one individual sensor |
| Repeatability | Estimating short-term scatter under stable conditions | Replacing calibration accuracy |
| Resolution | Understanding digital output steps | Claiming real-world accuracy to the last displayed digit |
 How to read the SHT40 accuracy curves
At 25°C, the SHT40 humidity curve is tightest through the middle of the range and widens near 0%RH and 100%RH.
| Condition at 25°C | Typical RH tolerance | Maximum RH tolerance |
|---|---|---|
| 50%RH | ±1.8%RH | approximately ±3.5%RH |
| 10%RH or 90%RH | approximately ±2%RH | approximately ±3.5%RH |
| 0%RH or 100%RH | approximately ±3%RH | approximately ±5%RH |
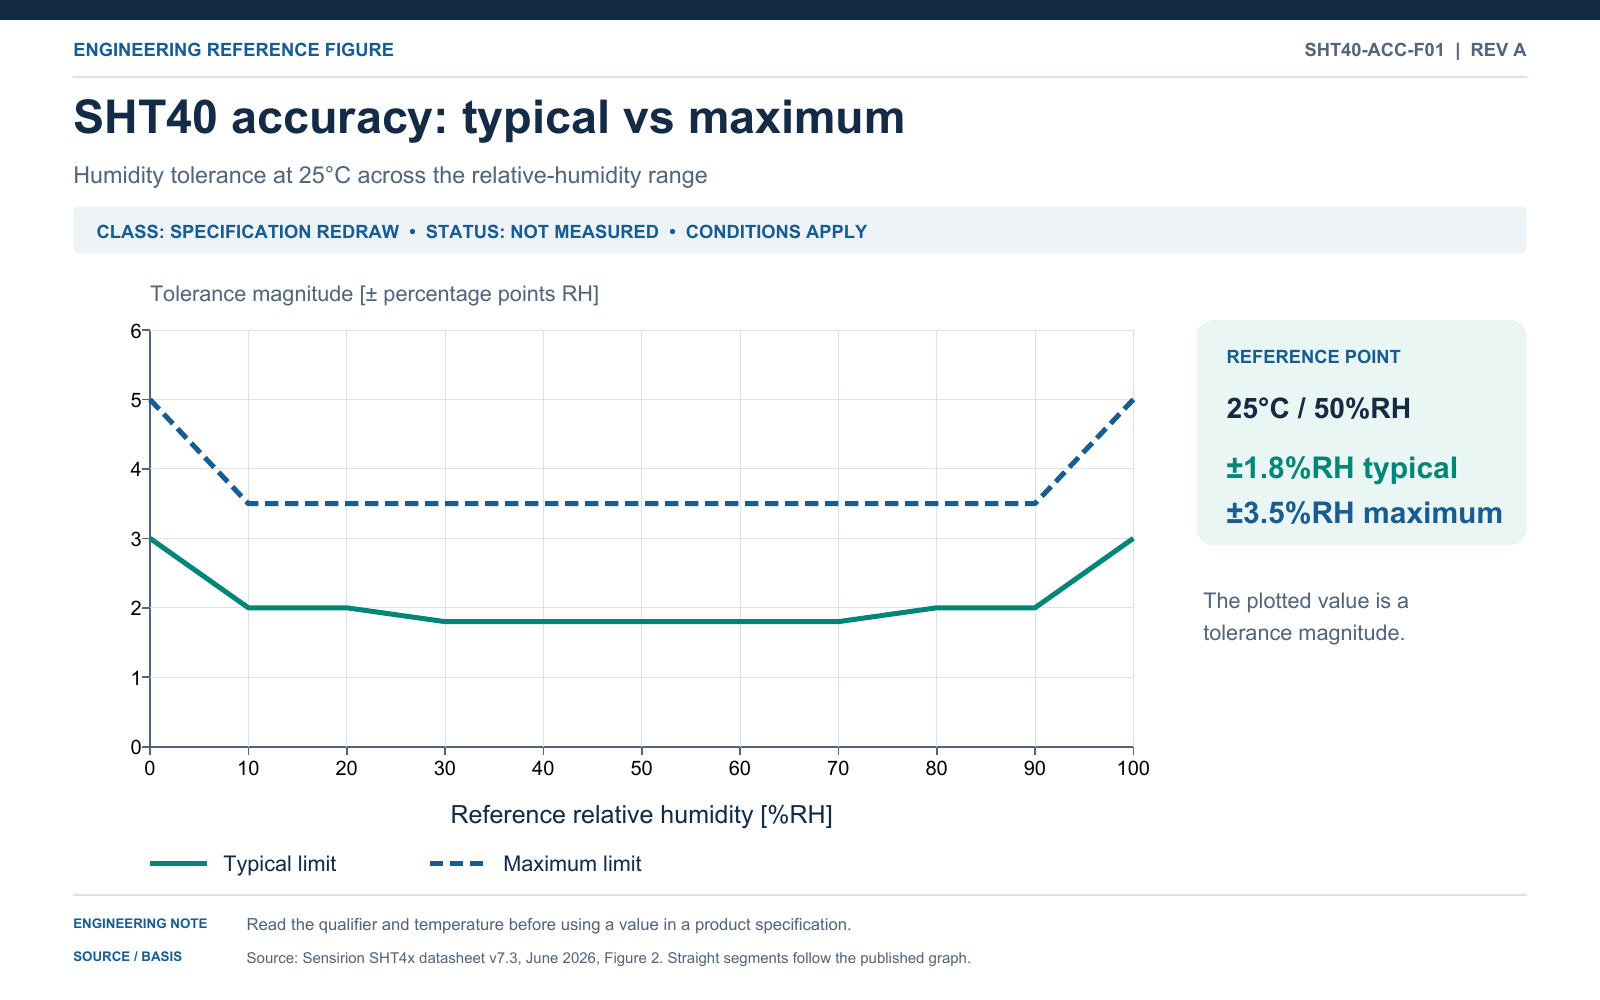
Read the manufacturer graphs in this order:
- Locate the real operating point. A room monitor at 25°C and 50%RH is not the same case as a cold-storage sensor near saturation.
- Read the curve label. A typical contour and a maximum boundary provide different evidence.
- Keep the condition attached. The 25°C maximum curve cannot automatically be extended over the full temperature range.
- Budget other effects separately. Hysteresis, drift and installation error are not removed by the calibration-accuracy number.
The datasheet's extended temperature-humidity map provides typical RH tolerance from 0°C to 80°C. It is not an equivalent full-range maximum map. For temperature, the SHT40 is ±0.2°C typical near room temperature, while the maximum curve is wider and reaches about ±1°C at the specified temperature extremes.
 Why an accurate sensor can produce an inaccurate product
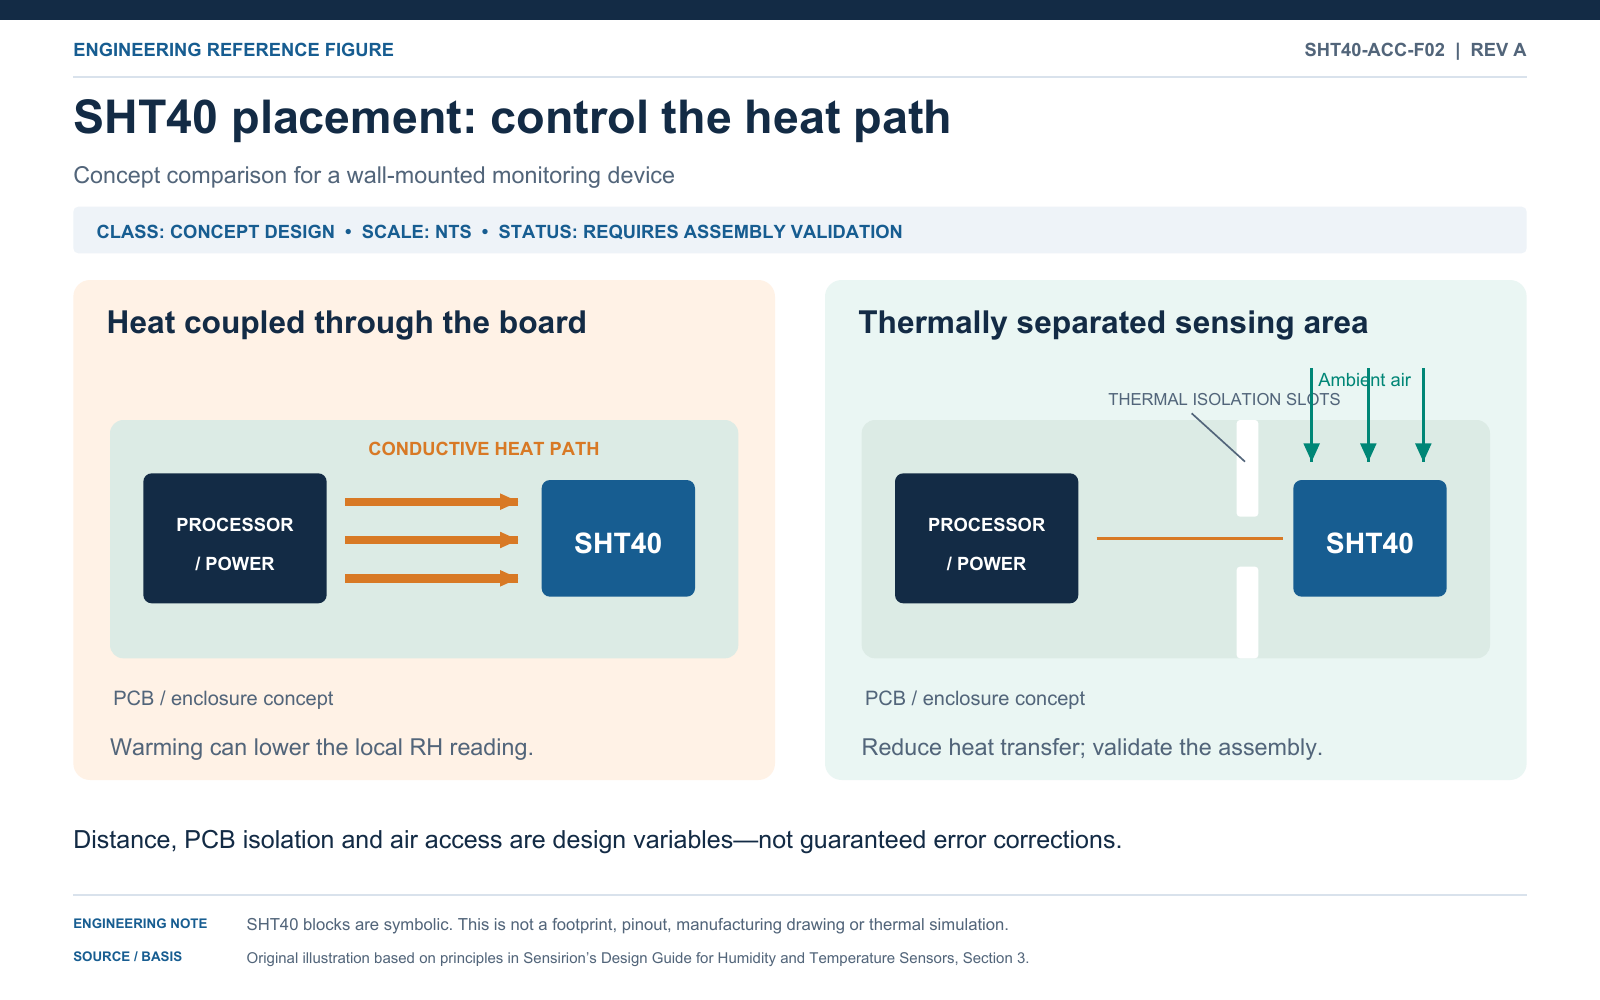
Relative humidity depends strongly on temperature. If electronics warm the SHT40 above the air the product is intended to measure, the device can report lower RH even when the sensor is behaving correctly at its local condition.
At 25°C and 50%RH, a constant-vapor-pressure calculation based on Sensirion's Humidity at a Glance relationship gives:
| Sensor temperature rise | Calculated local RH | Calculated RH difference |
|---|---|---|
| 0.0°C | 50.00%RH | 0.00 points |
| +0.2°C | 49.41%RH | −0.59 points |
| +0.5°C | 48.54%RH | −1.46 points |
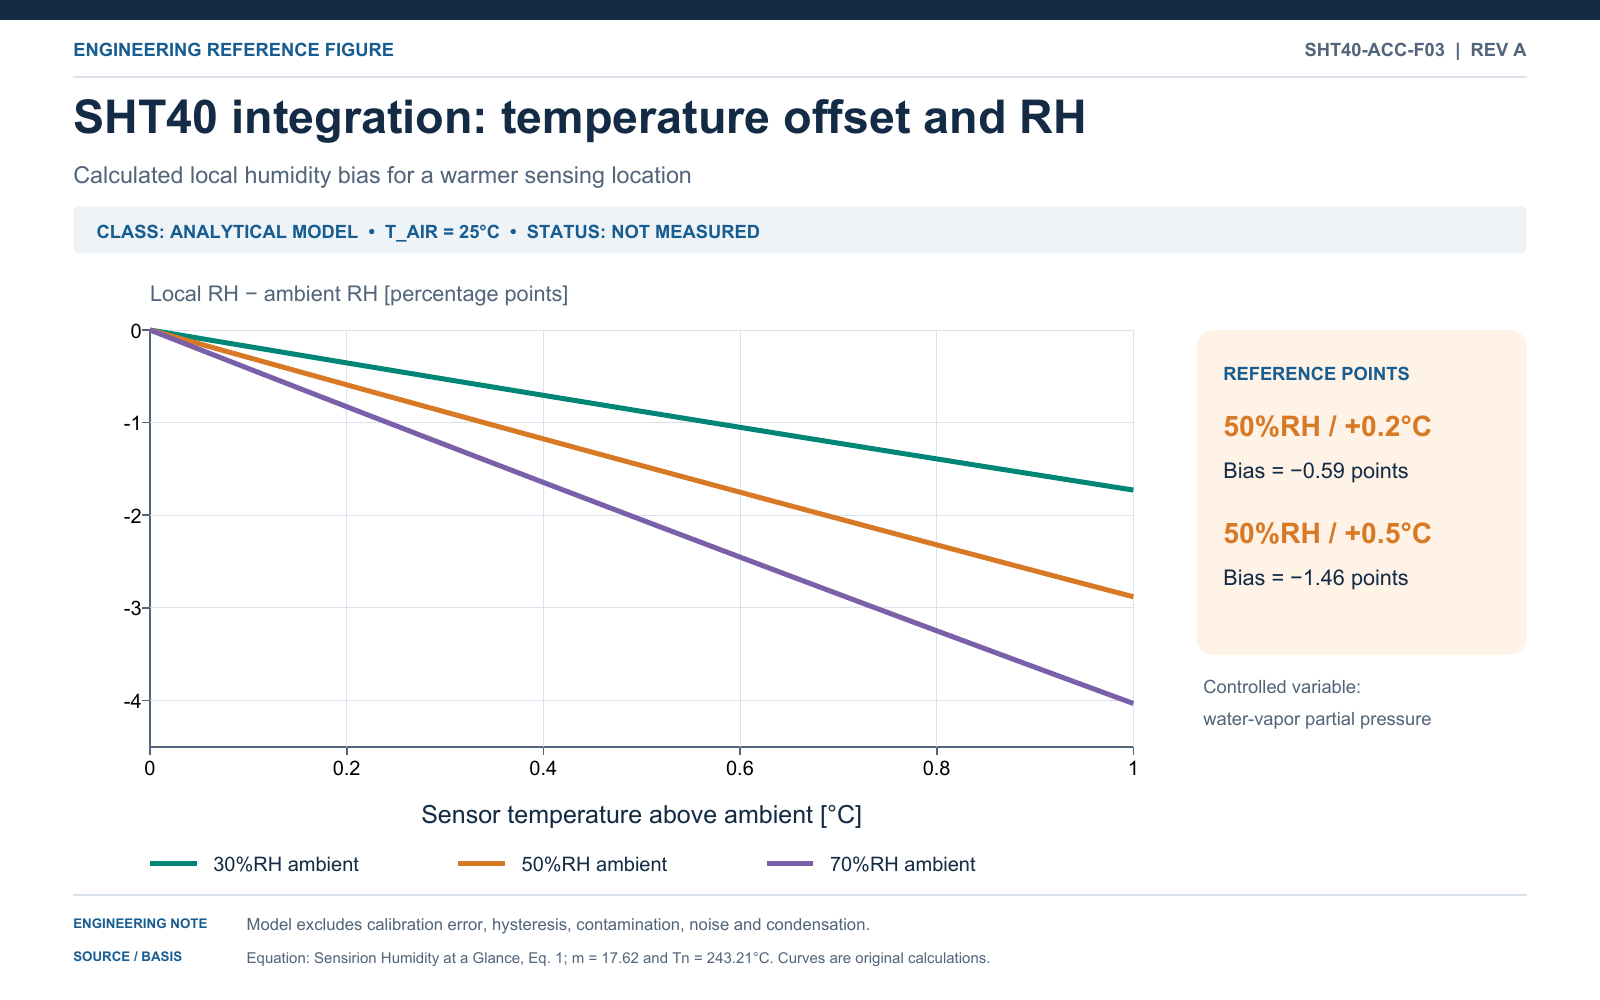
This is a design alarm, not a correction curve. Changing the displayed temperature in firmware does not cool the sensor. A useful design reduces the physical temperature difference through sensor placement, PCB isolation and representative airflow, then verifies the complete enclosure.
Other conditions that need explicit treatment include:
- humidity hysteresis: listed separately as ±0.8%RH at 25°C;
- normal operating range: best performance is stated for 5–60°C and 20–80%RH;
- long-term drift: specified as a typical value below 0.2%RH per year under normal conditions;
- chemical exposure and condensation history: these can create temporary offsets or accelerate ageing;
- test uncertainty: the reference instrument and chamber are part of the decision.
 Worked selection example: a ±3%RH indoor monitor
Assume a wall-mounted monitor must report ambient room humidity within ±3 RH points from 20–30°C and 30–70%RH. It has no per-unit humidity calibration, and the stated accuracy applies only after the enclosure settles.
At 25°C and 50%RH, SHT40's maximum calibration tolerance is already about ±3.5 points. The component limit therefore exceeds the entire finished-product target before adding thermal effects, hysteresis or verification uncertainty.
That conclusion does not say every SHT40 will fail. It says the published specification alone cannot support the proposed guarantee for arbitrary production units.
An initial comparison at the same condition makes the decision visible:
| Candidate | Maximum calibration tolerance | Hysteresis term | Example thermal allowance | Partial arithmetic screen | Fits ±3 points? |
|---|---|---|---|---|---|
| SHT40 | 3.5 | 0.8 | 0.5 | 4.8 | No |
| SHT41 | 2.5 | 0.8 | 0.5 | 3.8 | No |
| SHT45 | 2.0 | 0.8 | 0.5 | 3.3 | No |
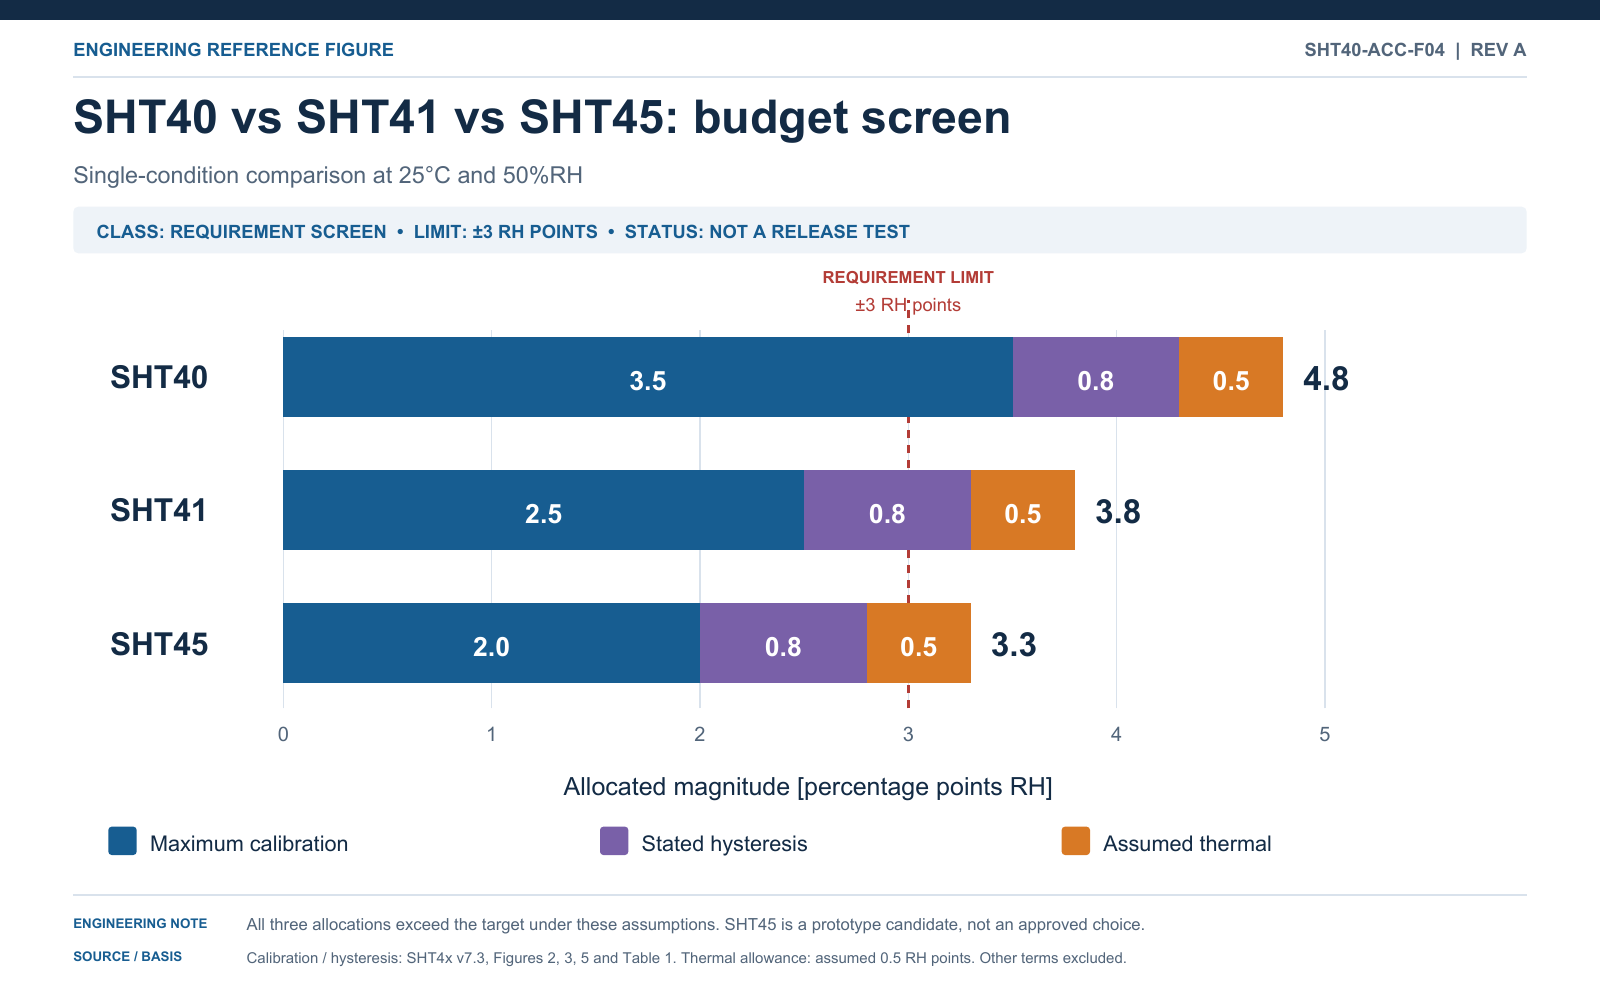
The sensible next step is to prototype the tighter SHT45 grade and improve the thermal layout while withholding the ±3%RH claim. Even SHT45 does not close the example budget without additional evidence. Per-unit calibration, production screening or a wider product requirement may be valid alternatives when their cost and uncertainty are included.
Do not apply root-sum-square automatically to make this table smaller. A statistical combination requires justified distributions, independence assumptions and an agreed confidence level.
 Application example: wall-mounted room monitor
The monitor contains an SHT40, MCU, display, radio and power converter. Its target is room air, not the warm pocket of air beside the processor. Place the sensing opening at an enclosure edge, keep heat-generating parts away, and reduce copper conduction to the sensor region. The Sensirion design-in guide discusses PCB slots, narrow connections and flex-mounted arrangements.

Electrical and firmware checks
The reference circuit uses a 3.3 V host, local 100 nF decoupling and I²C pull-ups. The datasheet's 10 kΩ pull-ups are a starting point; calculate the final value from bus capacitance, clock rate, rise-time requirement and sink capability.
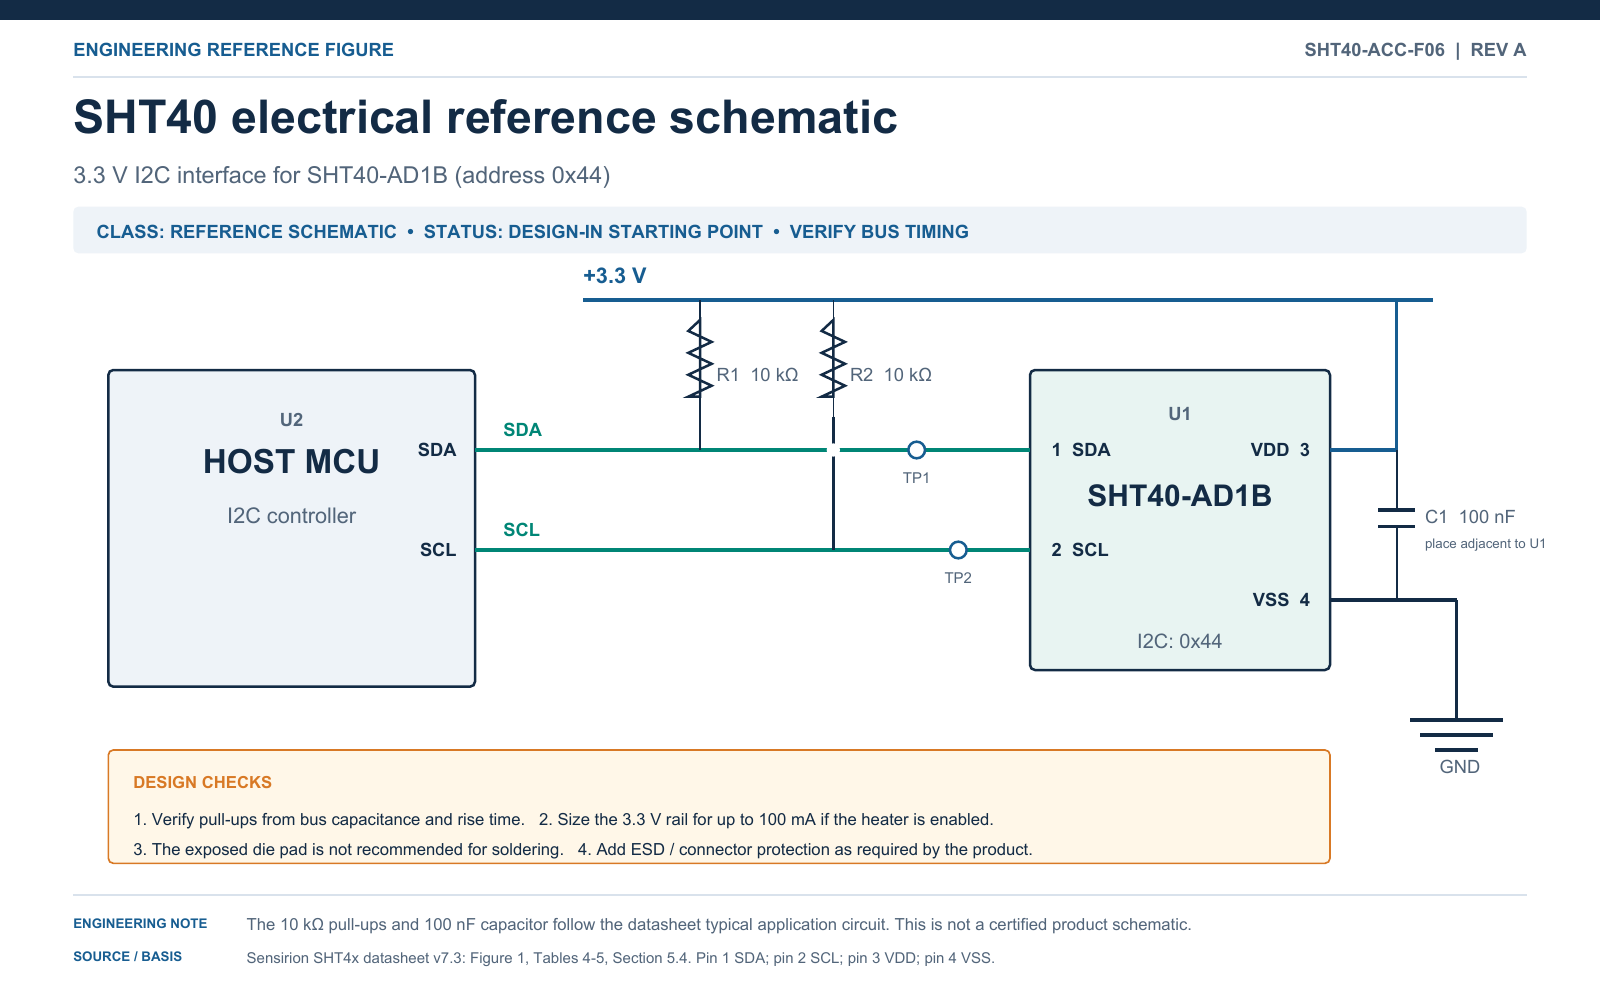
For a high-repeatability reading, send command 0xFD, wait at least the applicable maximum measurement time, read six bytes, and check the temperature and humidity CRC bytes separately. SHT4x does not use clock stretching. A read while the device is busy can receive a NACK.
temperature_c = -45.0f + 175.0f * raw_temperature / 65535.0f;
relative_humidity_percent = -6.0f + 125.0f * raw_humidity / 65535.0f;
Debug in layers: supply and idle bus levels, address ACK, command-to-read timing, six raw bytes, two CRC results, conversion, and finally correlation with display, radio and charging states. A stable but shifted RH reading is usually not an I²C problem.
The full application case contains the schematic notes, C driver, bus-debug workflow and commissioning-data method. Keeping those implementation details in a dedicated page lets this accuracy guide answer its main search question quickly.
What useful data analysis looks like
Log raw temperature/RH words, CRC status, reference readings, timestamps and device operating state. Compare signed DUT-minus-reference error rather than only plotting the two traces.
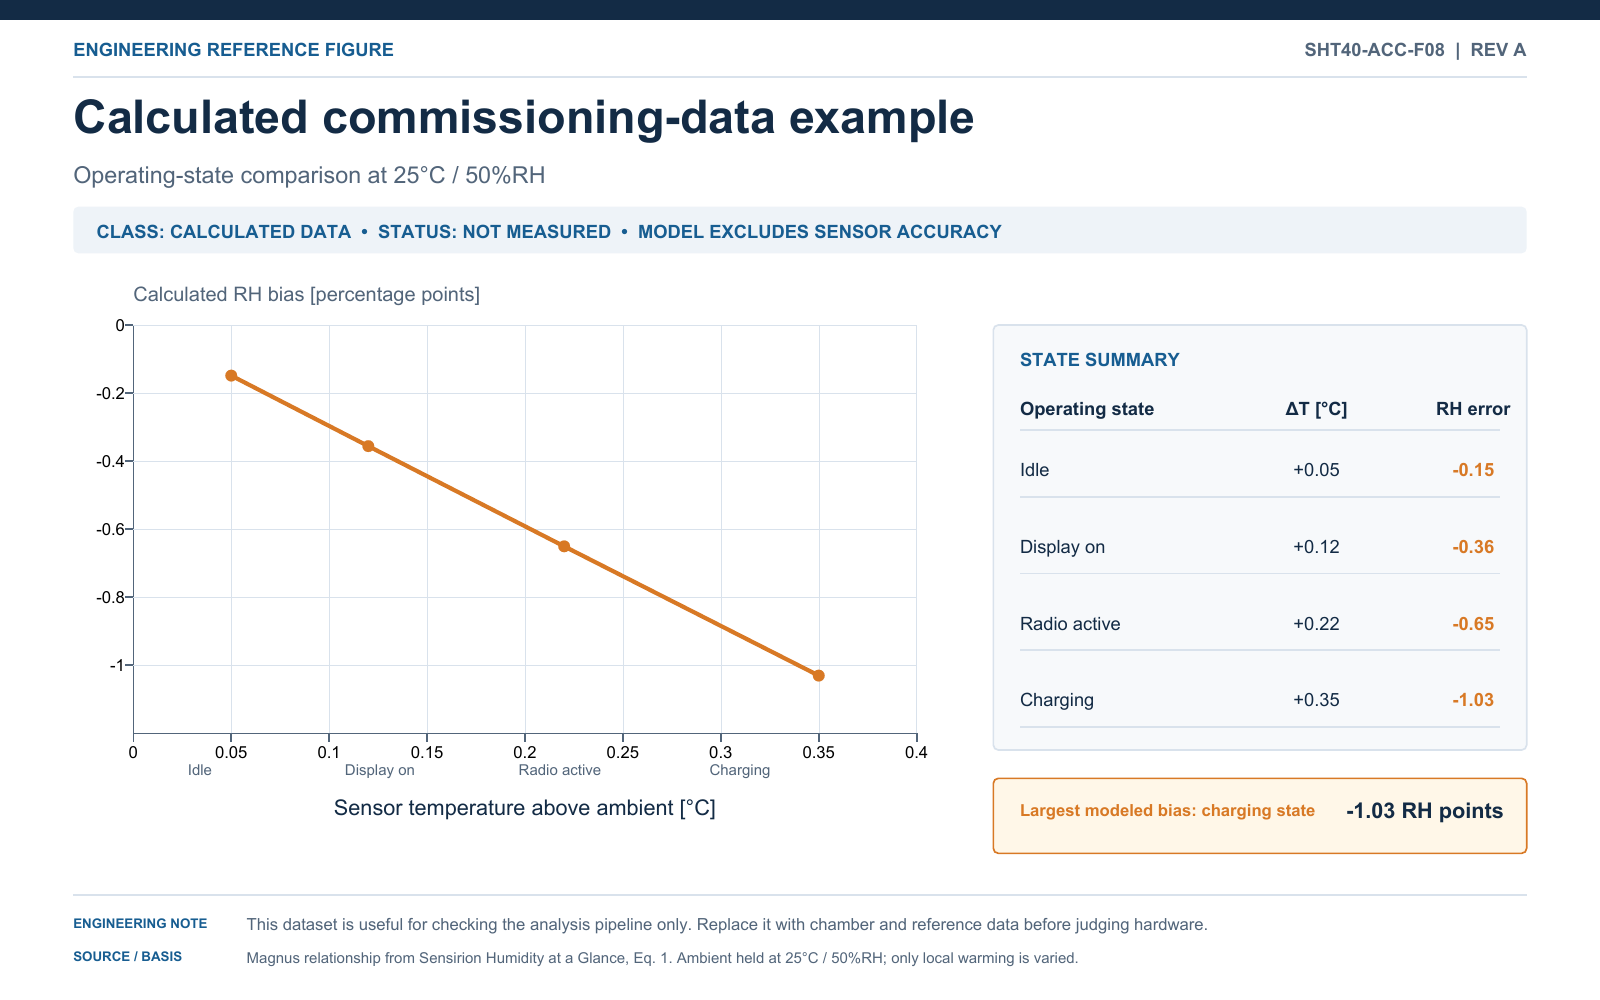
A calculated example at a fixed 25°C / 50%RH reference gives −0.15 point mean RH error in idle and −1.03 points during the assumed charging state. Those values test the analysis workflow only. Replace them with synchronized measurements from assembled devices before approving a layout or publishing a claim.
 How to verify the finished design
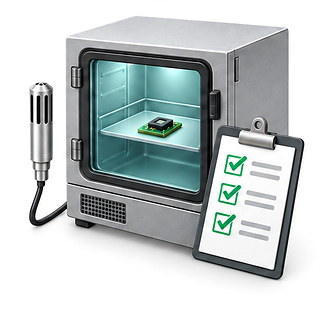
Start with a 3 × 3 grid: 20°C, 25°C and 30°C, each at 30%, 50% and 70%RH. Approach selected humidity points from both directions to expose hysteresis. Repeat relevant points with the display, radio and charging circuit in their normal states.
Use the same sequence for every unit:
- Record sensor part, lot, board, enclosure and firmware revision.
- Record the reference instrument, calibration status and applicable uncertainty.
- Define a settling rule before collecting results.
- Preserve raw readings and operating-state timestamps.
- Calculate signed error at each point and retain the worst applicable result.
- Apply a declared acceptance rule that includes measurement uncertainty.
For example, an observed error of 2.8 RH points with expanded uncertainty of 0.3 points does not demonstrate compliance with a ±3-point limit under the conservative rule |error| + uncertainty ≤ limit; the decision quantity is 3.1 points.
The validation record template provides reusable fields. Sensirion's Testing at Ambient Conditions explains why reference placement, gradients, coupling and settling matter.
SHT40, SHT41 or SHT45: which one should you choose?
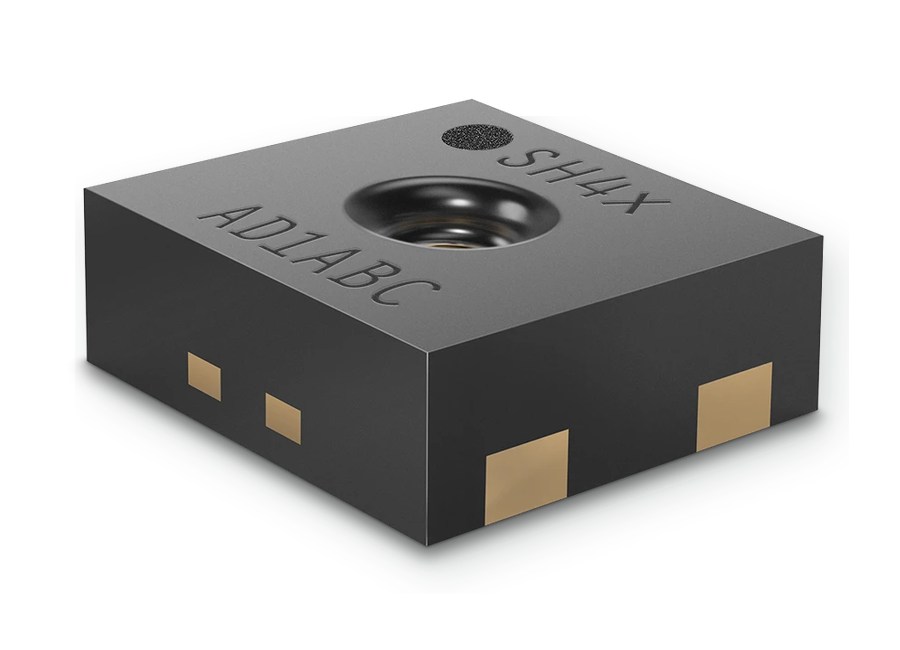
- RH accuracy
- ±1.8%RH typical
- Maximum
- ±3.5%RH
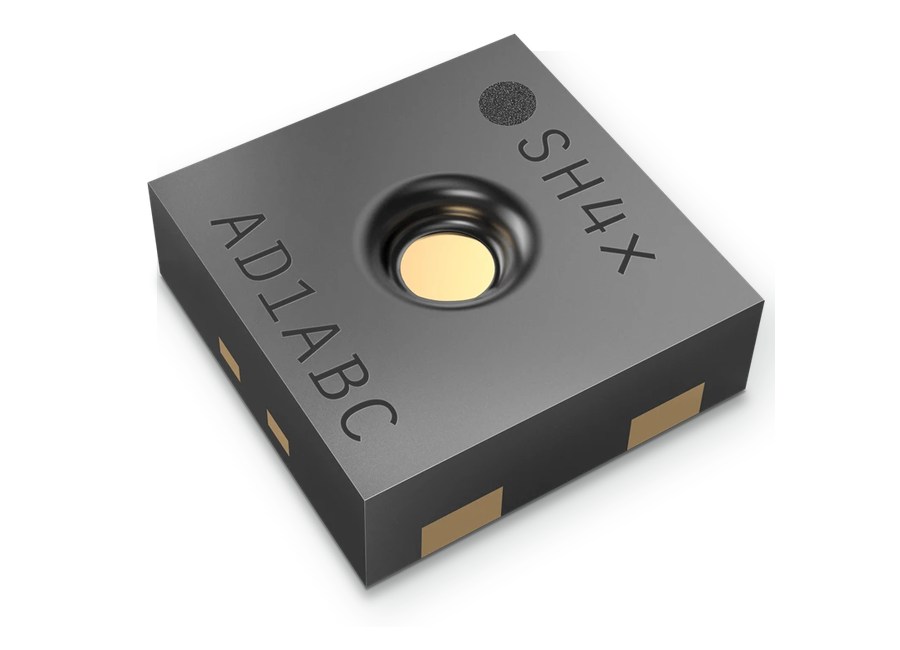
- RH accuracy
- ±1.8%RH typical
- Maximum
- ±2.5%RH
- RH accuracy
- ±1.0%RH
- Temperature
- ±0.1°C
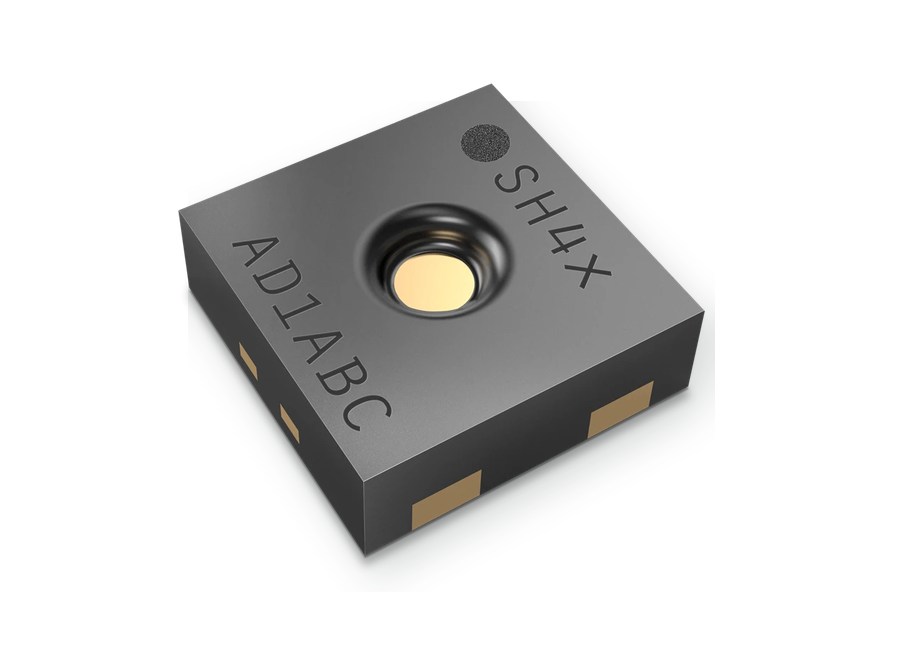
The three devices share the same compact SHT4x DFN package; the product grade and accuracy limits distinguish the order codes. Images are adapted from Sensirion’s official SHT4x product renders.
- Choose SHT40 when cost and power matter and the finished product can accept a moderate accuracy claim supported by system testing.
- Evaluate SHT41 when a tighter maximum RH tolerance is useful but SHT45 is unnecessary.
- Evaluate SHT45 when humidity and temperature accuracy are central requirements and the added component cost is justified.
The choice cannot correct poor sensor placement. A thermally isolated SHT40 can outperform a badly integrated higher-grade part in the finished device, while the higher-grade part still offers the stronger component specification when both are integrated well.
Frequently asked questions
Is SHT40 accuracy really ±1.8%RH?
Yes. ±1.8%RH is the typical specification in the central humidity range under the stated conditions. It is not the maximum error guaranteed for every unit.
What is the maximum SHT40 humidity error?
At 25°C, the maximum curve is about ±3.5%RH through much of the central range and widens toward about ±5%RH at the endpoints. Read the current datasheet curve for the exact operating point.
Why does SHT40 read high temperature and low humidity?
The sensor may be warmer than the intended ambient air because of PCB conduction, a display, radio or power circuit. At constant vapor pressure, local warming raises the measured temperature and lowers local relative humidity.
Can I calibrate SHT40 with one reference point?
A one-point correction can reduce offset near that condition, but it does not establish accuracy across temperature, humidity, humidity direction, ageing or device operating states.
Does high-repeatability mode improve accuracy?
It reduces short-term measurement noise. It does not change the sensor's accuracy grade or eliminate a fixed calibration or thermal offset.
Can the internal heater improve normal measurement accuracy?
The heater is useful for demanding conditions such as condensation management and diagnostics, but readings during heating do not represent ambient temperature and RH. Resume reporting only after a recovery rule validated for the enclosure.
Primary sources
- Sensirion SHT4x datasheet — component specifications, accuracy curves, electrical interface and operating conditions.
- Sensirion SHT40 product page — product positioning and current downloads.
Engineering decision: treat ±1.8%RH as an expected-performance figure, check the relevant maximum curves against the requirement, and qualify the complete enclosure. That sequence turns a component specification into a defensible product claim.
Evaluate the complete sensor assembly
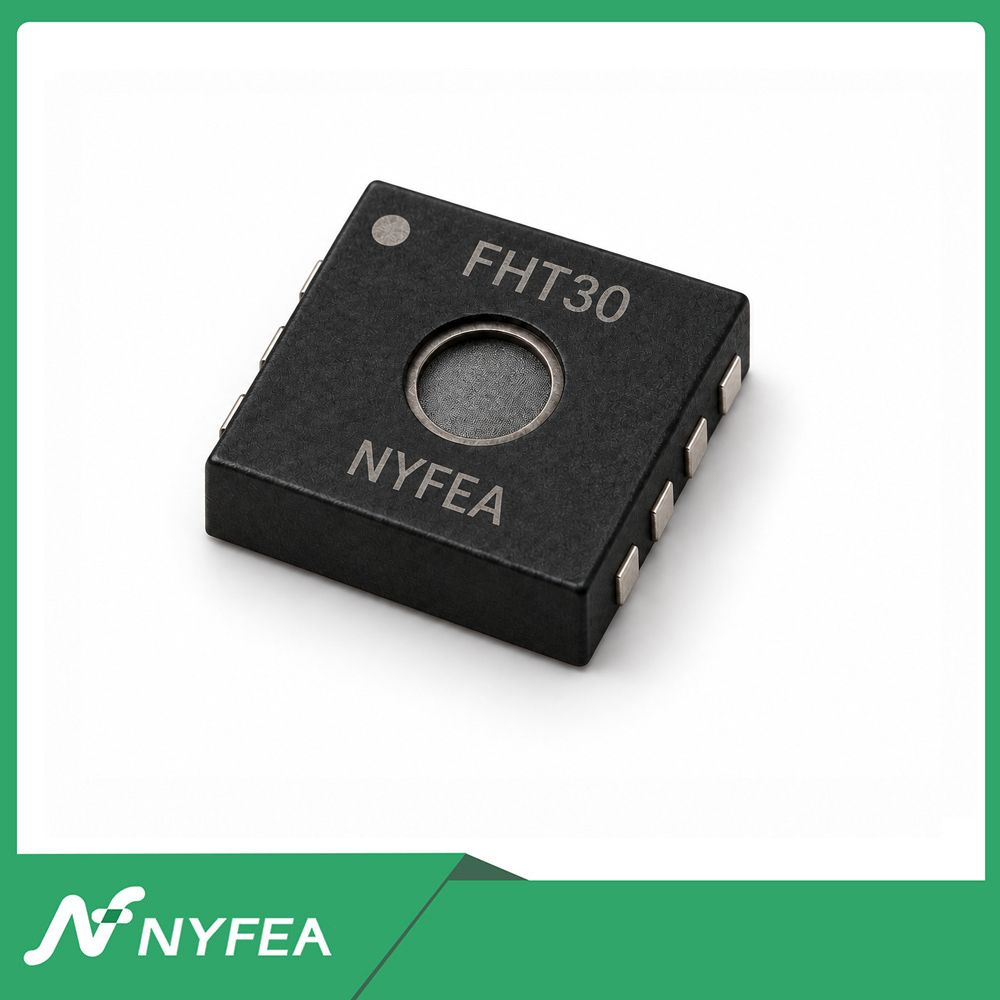
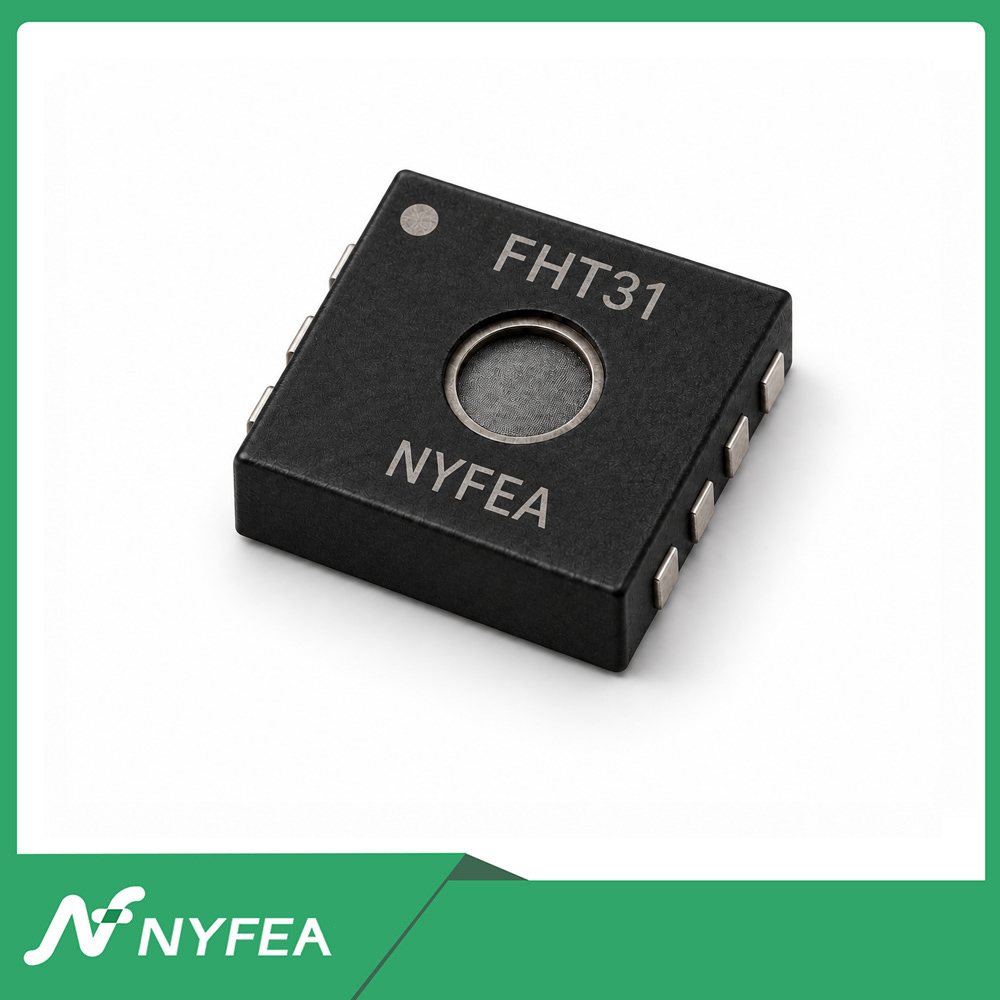
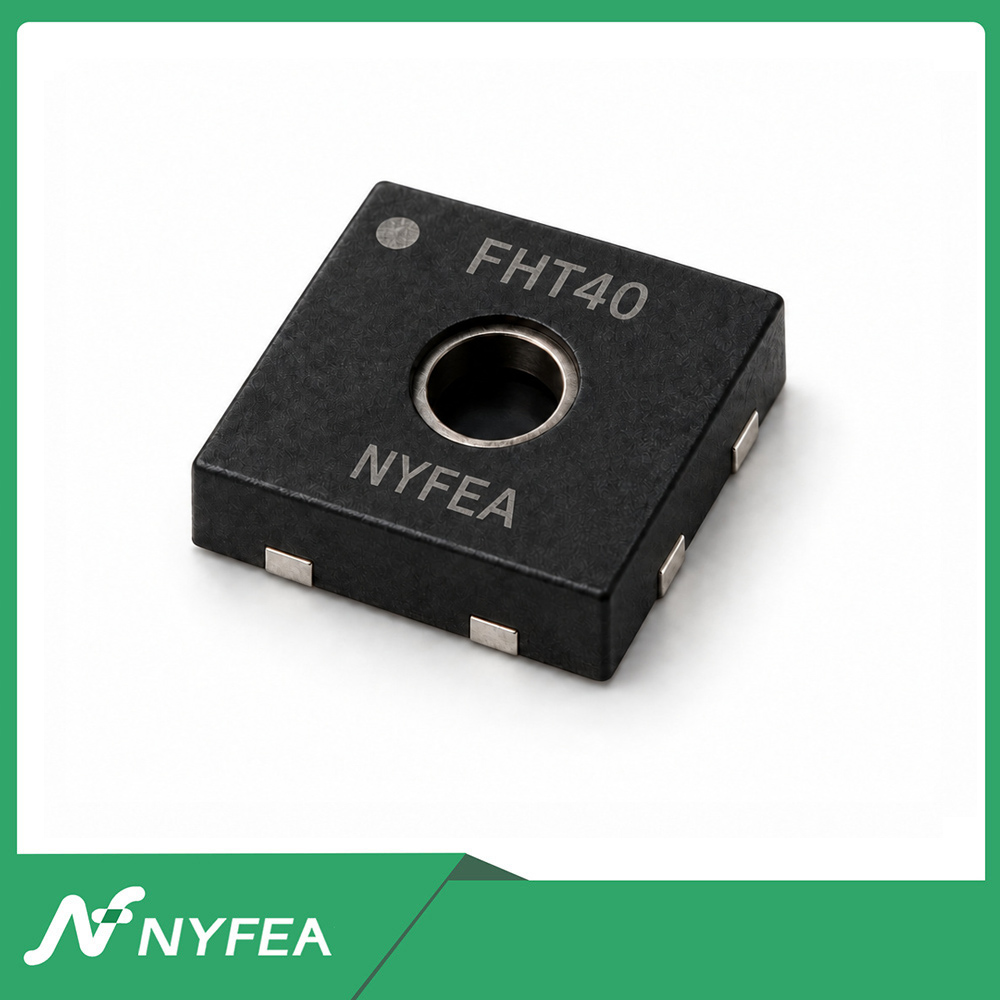
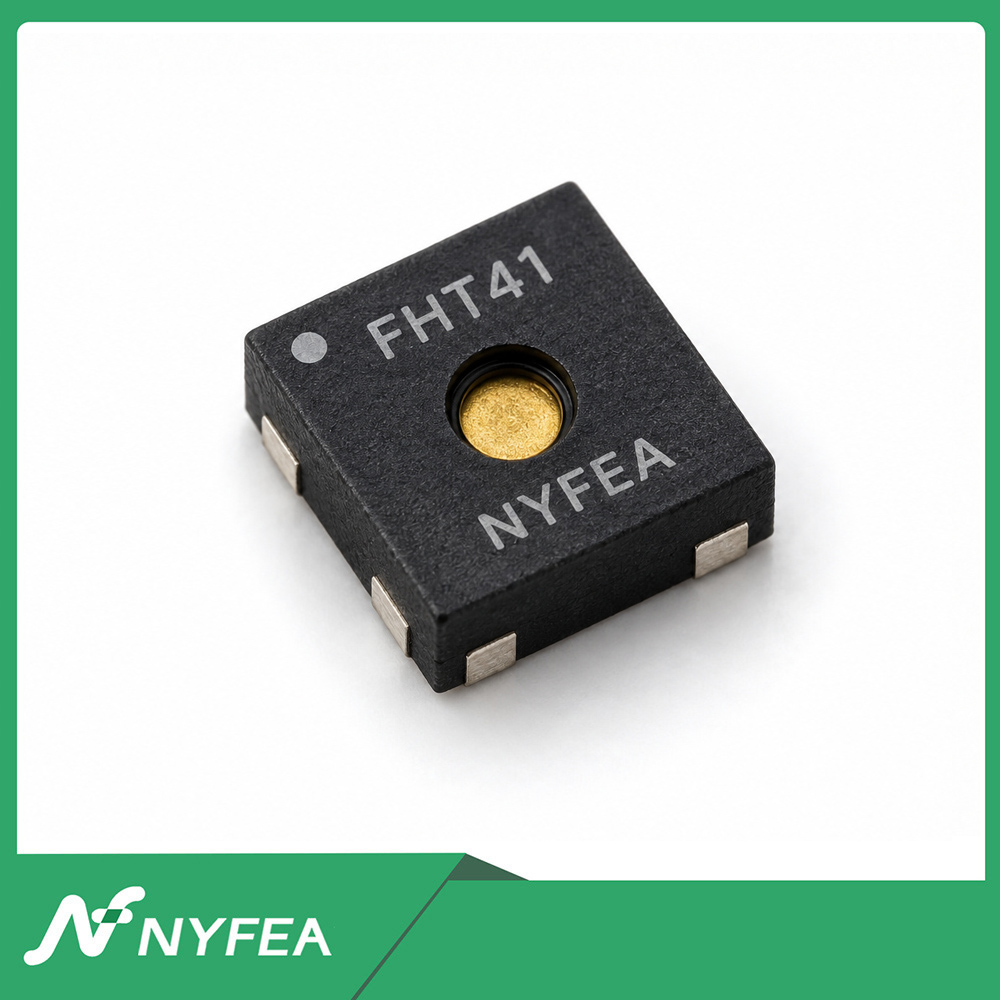
NYFEA FHT40 is an independent temperature and humidity sensor candidate for new greenhouse designs. Compare the exact device datasheet, interface, package, protective housing and environmental test results before considering it for this controller.